
How to build and maintain an Experiment dashboard

Getting enterprises to embrace a culture of experimentation is a tremendous challenge. The rising popularity of scaled agile frameworks (SAFe), while intended to increase visibility and communication, often creates more overhead without increasing leadership’s confidence that teams are delivering the right results. The most successful product teams realize that change is inevitable, and their teams will deliver their best work if, instead of focusing on plans, they define clear outcomes and metrics, ruthlessly prioritize work, and take an iterative approach.
One of the biggest hurdles is helping executives understand what teams are working on and the value they are providing when they aren’t being measured by feature outputs. Being able to properly tell this story is essential for product managers and leaders, but is often mishandled.
Experiment Dashboard Approach
At InfoBeans, we use an Experiment Dashboard to track and communicate progress towards our project’s objective. The Experiment Dashboard works because it is :
- Makes current status visible to the whole team
- Easily updated
- Shareable to other executives and teams
- Tells a coherent story
- In a format that makes sense to senior leaders
We’ve created Experiment Backlogs in AirTable as well as more traditional Google Sheets / Excel. We’ve found that Excel is a natural and familiar fit in most enterprises.
InfoBeans’s Experiment Dashboard
Our Experiment Dashboards help us share easily digestible insights with executives and adjacent teams. Plus, they seamlessly combine qualitative and quantitative information.
The experiment dashboard is broken down into a few different sheets:
- Hypotheses
- Experiments
- Participants
- Summary
Occasionally we will supplement this with additional sheets for more information or particular client needs. Let’s take a look at each of these sheets.
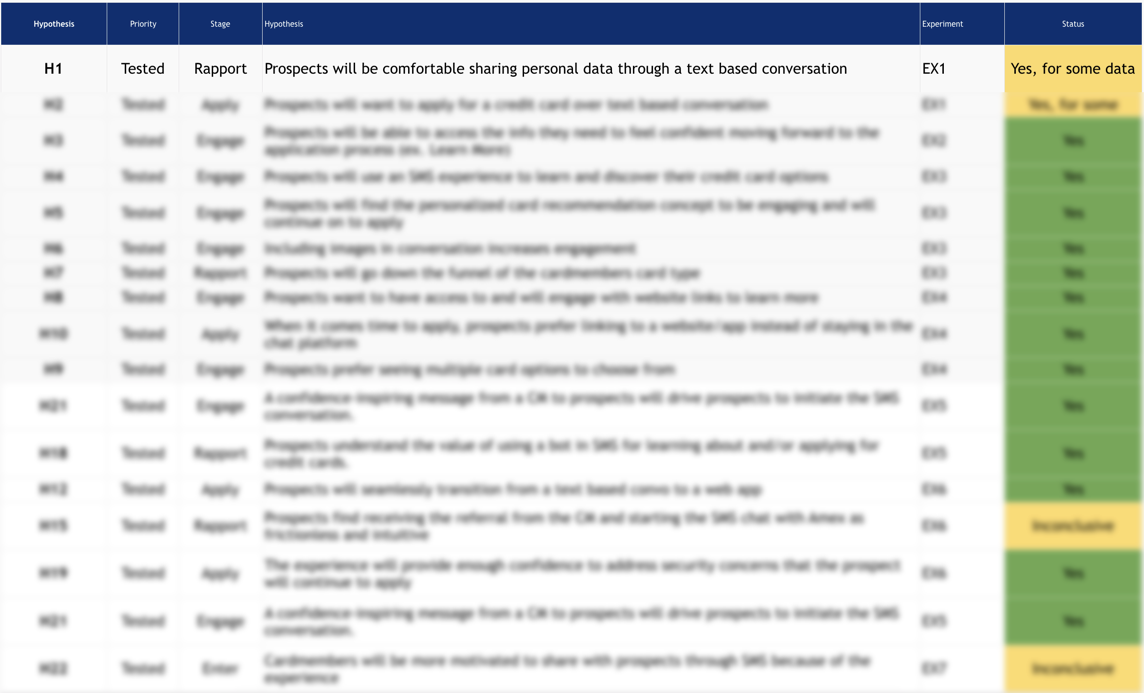
Hypotheses
The dashboard revolves around the hypotheses that we have for the product that we are building. At the project kickoff, we run a collaborative brainstorming exercise to hash out all the assumptions and ideas that we have that need to be tested or explored further. We add to this hypothesis list consistently throughout a project. Thinking in terms of hypotheses is a critical skill in the modern world of product development that we have covered at some length previously.
On this sheet we have the following columns:
- Hypothesis #: Each Hypothesis needs an ID so we can reference it and tie experiments to hypotheses.
- Stage: Not always necessary, but we typically will mark where a hypothesis falls in our customer journey or conversion funnel. This helps us prioritize types of experiments.
- Hypothesis: The hypothesis statement defines the desired outcome..
- Experiment #: For Hypotheses that have been tested we ID the experiments that they were tested within.
- Results: Was this validated (yes), invalidated, inconclusive or to be tested still. We typically color code this field for easy tracking.
- Additional Research / Questions: If during an experiment further things came up that need to be investigated, we will add additional context.
- Learnings: For hypotheses that we have tested, we drop in the high-level learnings as bullet points
As we run experiments, we inevitably unearth new hypotheses that are added to our dashboard as new rows. Each sprint we review the hypotheses and prioritize them.
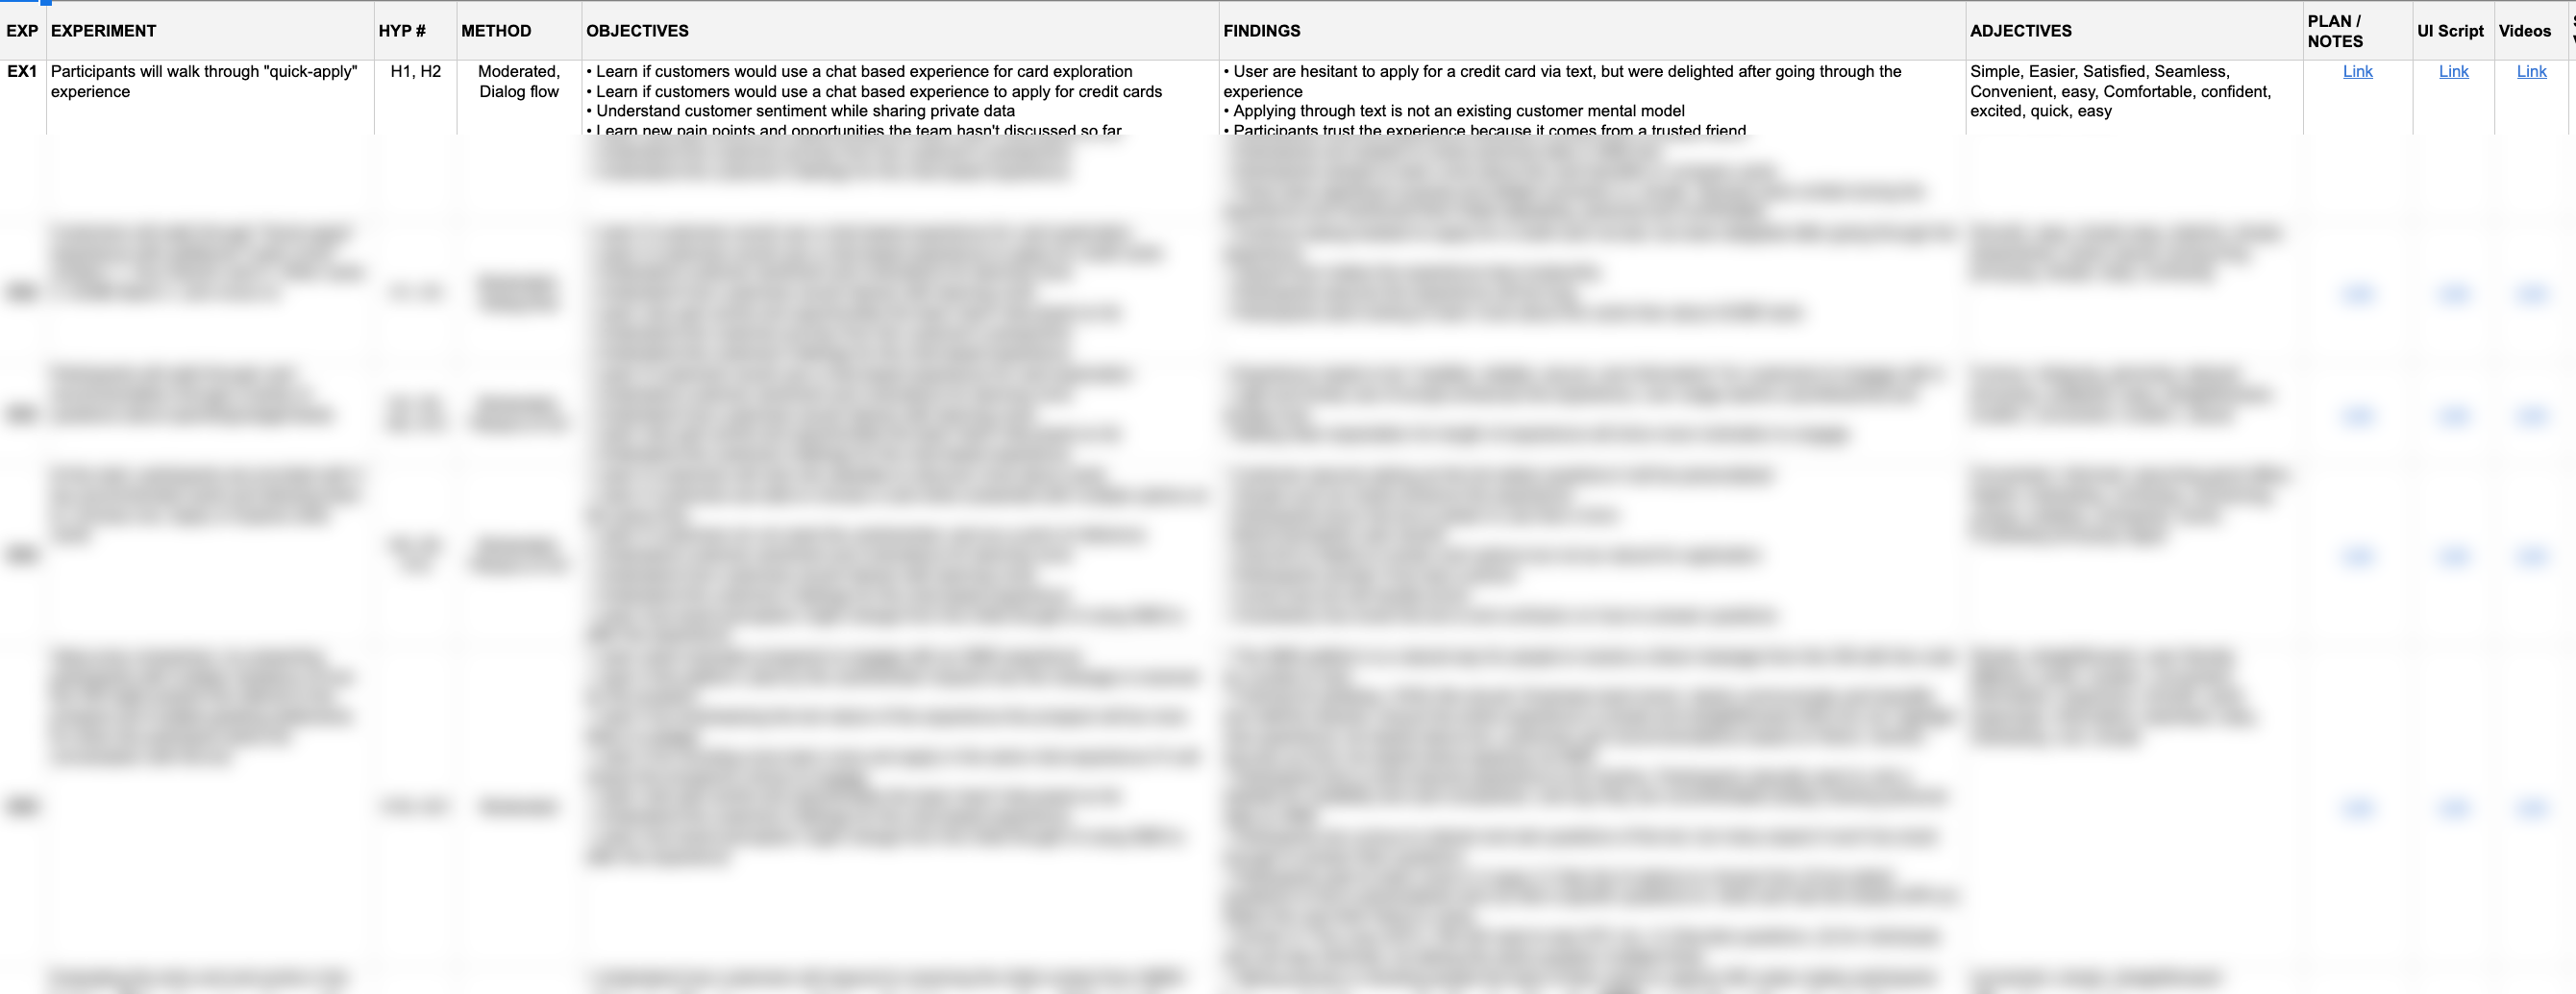
Experiments
The next worksheet is the Experiments Sheet, where we list experiments that are in flight or have been completed.
In each Sprint Planning session, we select one or more experiments to run. In Experiment Driven Design, we don’t necessitate that an experiment must be completed in a fixed amount of time. Some experiments will take weeks to complete, while others will only take a day or two. All of the columns except the findings are updated when we kick off the experiment. Once the experiment is over we update the Findings section as well as update the Hypothesis worksheet.
On this sheet we have the following columns:
- Experiment #: Like each hypothesis, we ID the experiments so we can cross-reference them easily.
- Experiment: A brief explanation of the experiment we are going to run.
- Hypothesis #: We cross-reference the hypothesis that we are testing within each experiment.
- Method: This is the type of experiment we are running eg. an Interview or Landing Page Test.
- Objectives: We list out the objectives for each experiment, in particular, what we are trying to learn.
- Findings: High-level bulleted findings get dropped right in the dashboard for easy consumption.
- Plan / Notes: Link to the research plan and any raw notes
- Interview Script: The script to the interview for your research or experiment.
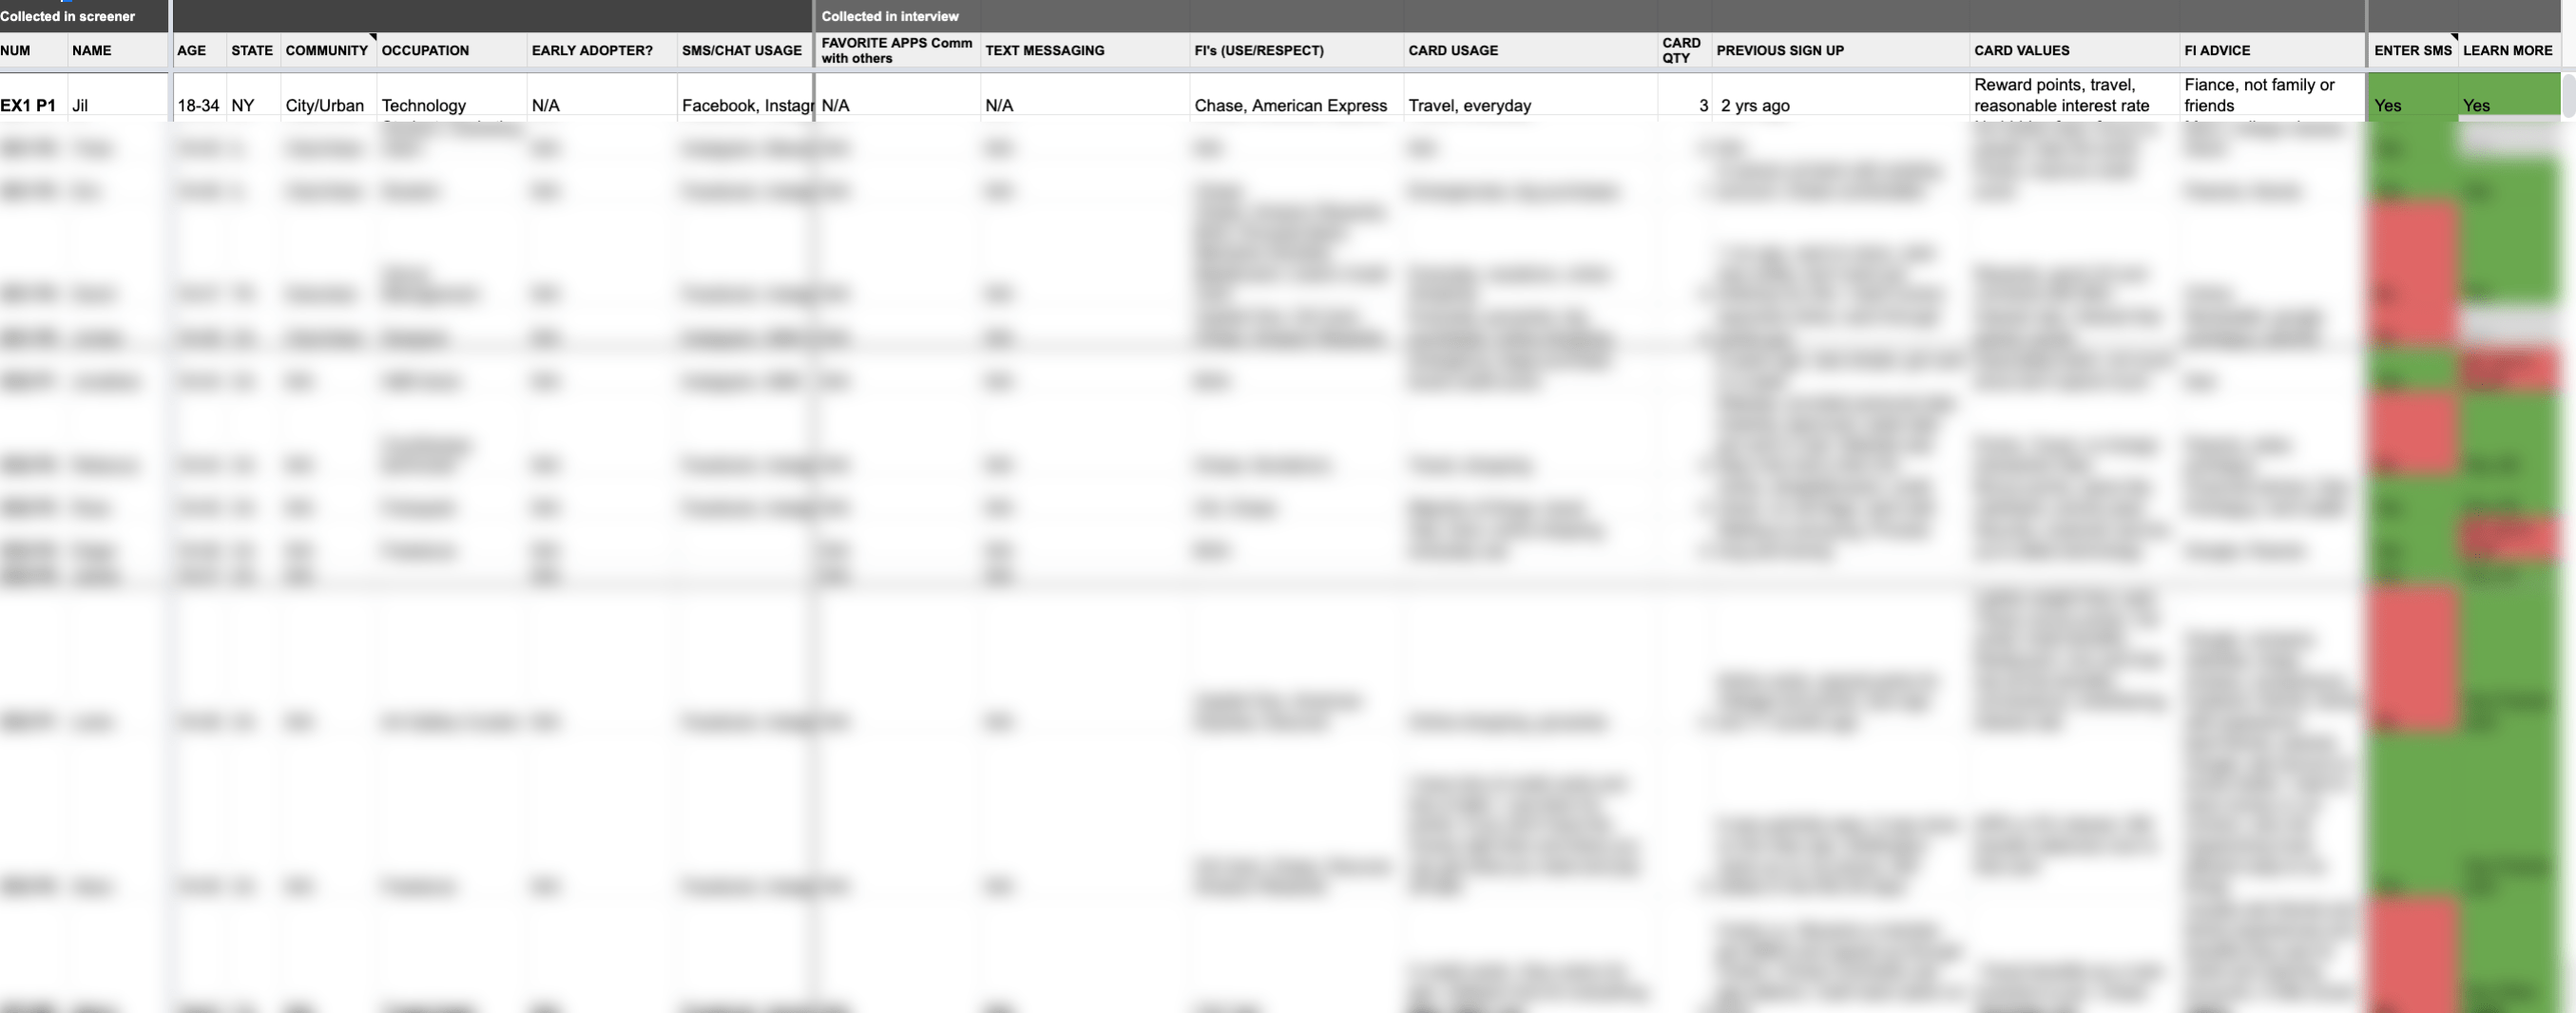
Participants
The Participant’s worksheet should be tailored to your project. It will have basic demographic information. It also can include background questions that you ask in your interviews. You can also track how they felt at key points in the customer journey or other key areas that come up in the majority of your experiments.
We update the Participant’s worksheet after each interview. In some cases, we might even use this worksheet as a live notes document and update it during the interview itself.
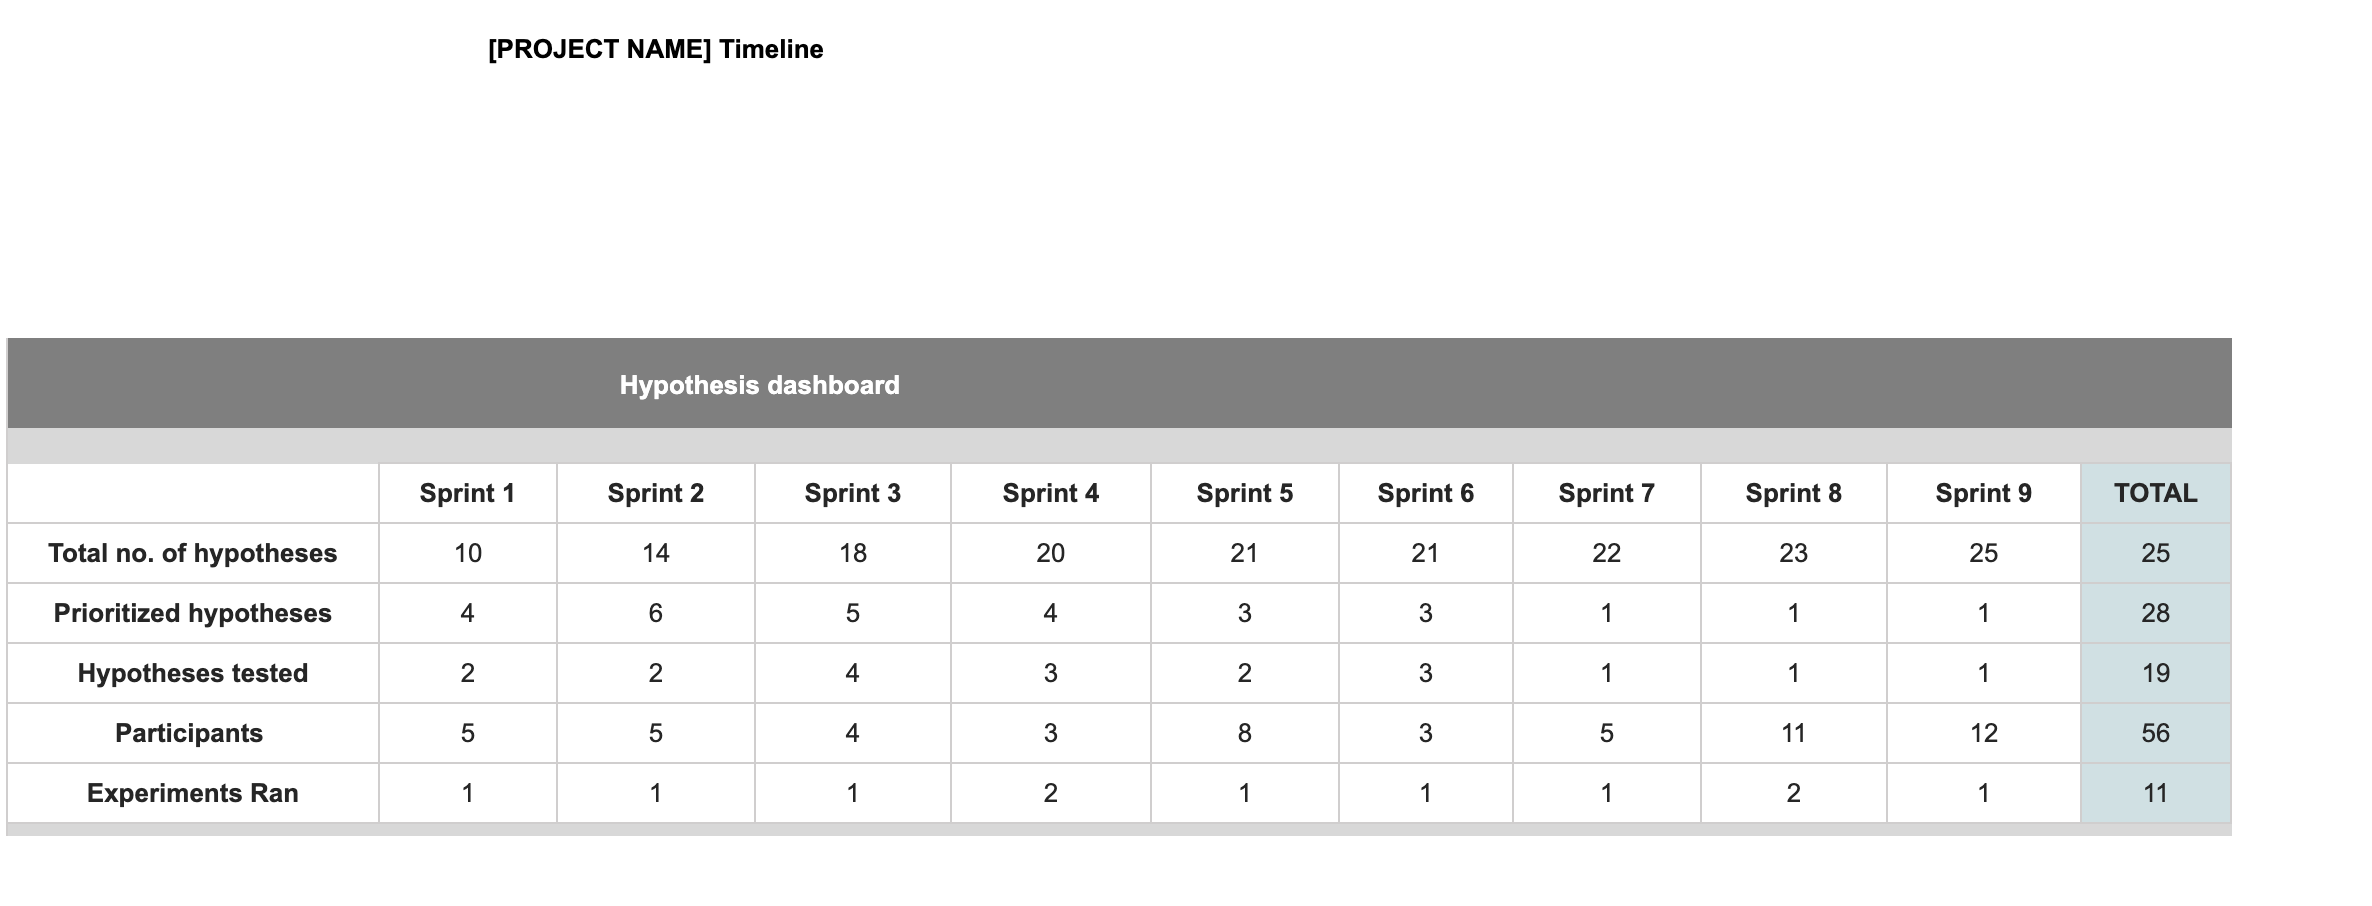
Summary
This sheet serves as a summary of the work on previous sheets. It provides a high level of the number of hypotheses, experiments and what you have run each sprint. It’s a great way to showcase the hard work of the team to leadership.
We update the Summary worksheet before each Sprint Review meeting.
***
Link to Sample Experiment Dashboard
The Experiment Dashboard is a tool to help you track the progress of your experiments. It is designed to be easily shareable and consumable by different teams within your organization. We hope you will find it as useful as we do!

Related content
Application Development
We have designed and developed hundreds of websites, web apps, mobile apps and software platforms.
Mobile Development
We design and build custom enterprise mobile applications from the ground up.
Cloud
We help you meet your compliance, governance, and availability requirements for cloud migrations.


Stay up to date with InfoBeans
Insights from our team of experts who deliver digital software day in and day out.
![]() Thank you for signing up!
Thank you for signing up!
![]() Thanks a lot for your interest. You are already a subscriber. You will receive your first newsletter soon.
Thanks a lot for your interest. You are already a subscriber. You will receive your first newsletter soon.